en
Language
  • en
  • de
  • fr
  • es
  • br
  • ru
  • jp
  • kr
AI translation
  • ee
  • ae
  • cn
  • vn
  • id
  • eu
  • il
  • gr
  • no
  • fi
  • dk
  • se
  • tr
  • bg
  • nl
  • it
  • pl
  • hu
  • ro
  • ua
  • cs

Statistics for performance evaluation

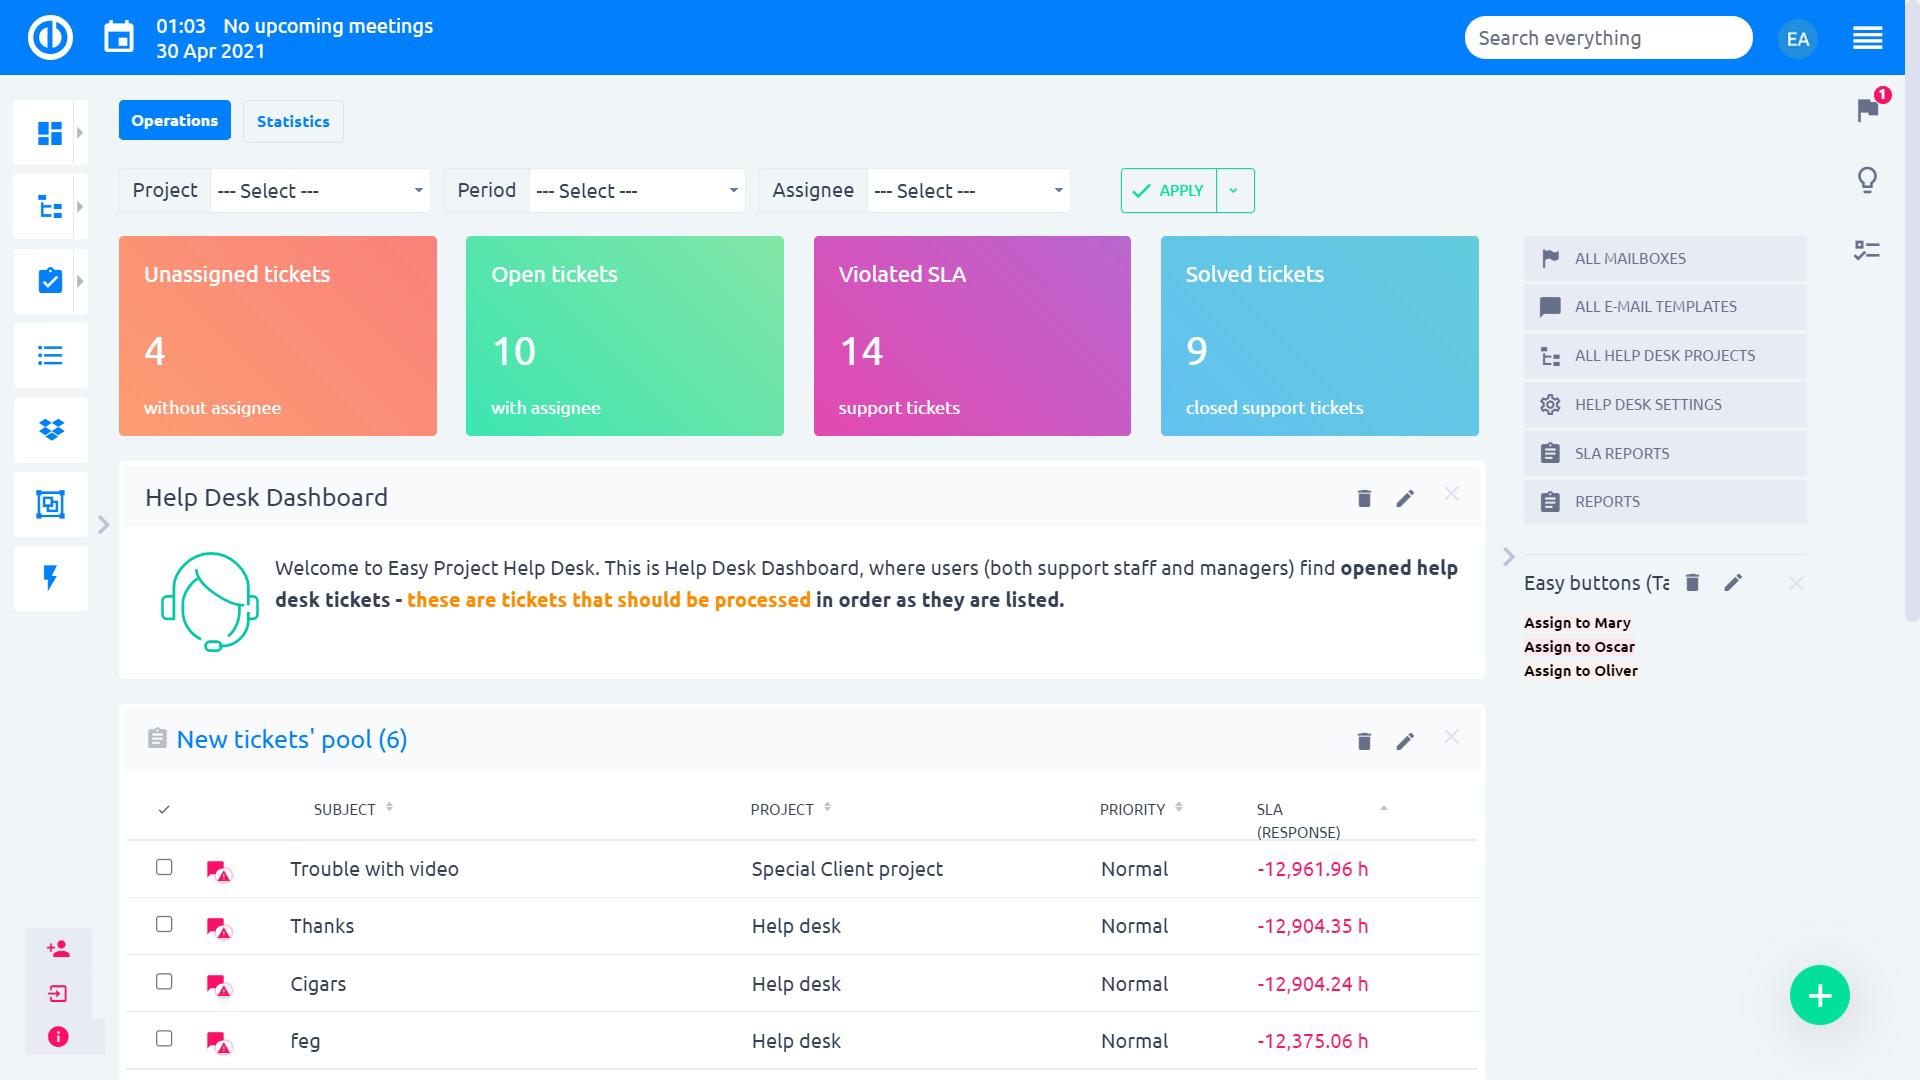
Tracking performance of your Help desk has never been easier. Thanks to the statistics monitoring features you can get a quick overview of your support service performance. Help desk statistics are incredibly customizable. Examples of statistics include closed tickets per operator, average spent time per closed ticket, average first response time, number of replies per ticket and many many more that you can think of. It is possible to view and compare statistics for a different time period, operator, project, allowing for a neat cross-sectional analysis of Help desk performance.

By adding a new attribute to help desk tickets – ticket owner, we expanded the performance evaluation possibilities. Now you can also monitor closed tickets per owner, instead of just by the operator who closed the ticket himself, or you are able to closely monitor the longest open tickets per owner (regardless of whether they are assigned to him).

In addition to filtering a specific module (chart, report, list), dashboards containing multiple modules can be filtered as a whole – one filter is applied to all contents. Such filtering is possible by date, user, project or country. SLA events can be used to monitor the fulfillment of prescribed SLA, but also general first response time or a number of replies in a ticket.
Try Easy Redmine in 30 days free trial

Full features, SSL protected, daily backups, in your geolocation