Webinar Recording: Reporting in Easy Redmine
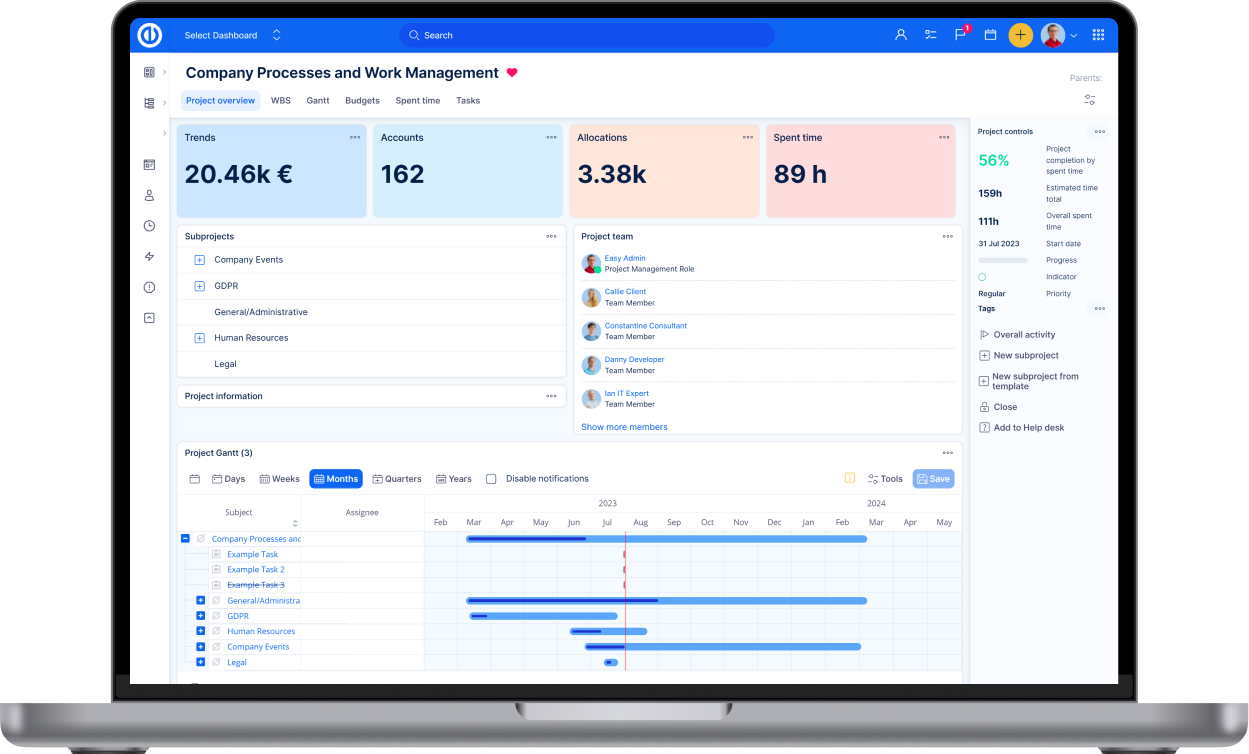
Learn how to easily create graphs and charts to visualize your data and get quick overviews of your team's and project's performance. Click on the play button below to start the webinar.

For more information about webinars, please go to this page.
