Documentation
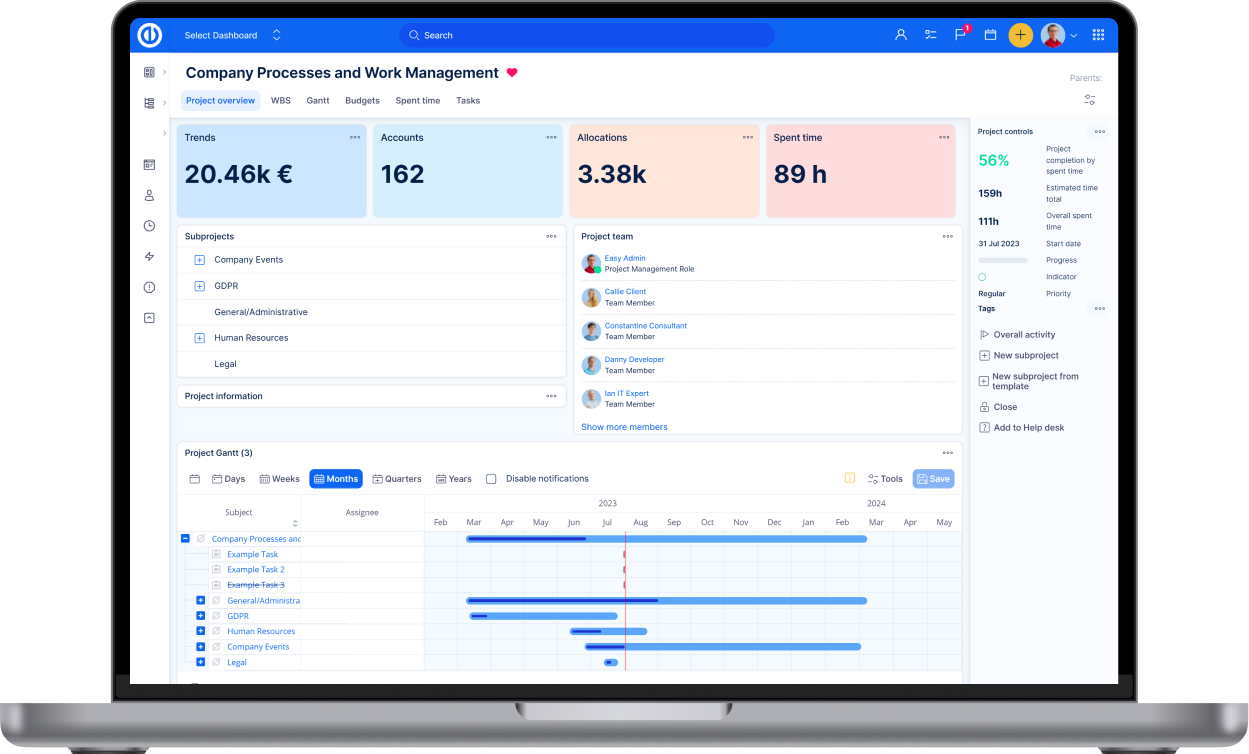
Project management
Learn how to set up projects, manage tasks, and track progress with waterfall and hybrid methodologies.
Agile tools
Discover how to run sprints, manage backlogs, and use Kanban boards for agile project delivery.
Resource management
Find out how to plan team capacity, allocate resources, and track workload across projects.
Project budgets / finance
Master project cost tracking, budget planning, and financial reporting for better project control.
Expert PM tools
Explore advanced features like Gantt charts, Work Breakdown Structure, and risk management capabilities.
Help desk
Set up customer support workflows, manage tickets, and configure SLA tracking for service delivery.
B2B CRM
Connect sales processes with project delivery and manage client relationships throughout the project lifecycle.
Add-ons
Install and configure additional features to extend Easy Redmine's functionality for specific needs.
Advanced administration
Configure system settings, manage user permissions, and customise workflows for your organisation.
Corner situations
Solve unusual scenarios and handle edge cases that might occur during daily project work.
Release notes
Stay updated with new features, improvements, and changes in the latest Easy Redmine versions.
For server admins & developers
Access technical guides for installation, API integration, and system customisation.
Troubleshooting (error 500)
Fix common technical issues and resolve system errors that may affect your Easy Redmine instance.