Easy Redmine tutorials by Easy
How to use Adaptive Project and Work Management suite Easy Redmine efficiently? Learn from short video tutorials by Easy. Get the boost to your projects!

Organization structure is a form of a tree hierarchy where every user in the organization, except the top one, is subordinate to a single another user. This arrangement helps define how activities such as task allocation, coordination, and supervision are standardly directed toward the achievement of organizational aims. It also determines who is eligible to approve vacation requests submitted by users.

Create powerful UML or other diagrams right within your tasks, dashboards, knowledge base, requirements or test scenarios. Edit and update diagrams without need of any other software. Draw.io alternative is integrated right within Easy Redmine.

Risk Management is a mandatory process for each correctly managed project. This tool allows to set the risk matrix through your organization, manage risks on projects and provide global risk reporting and overview for management. The global module is suitable for the roles of Line Manager, Risk Manager or Project Management Officer (PMO), while the project module is optimal for Project Manager, allowing him to manage project risks in a controlled manner per each particular project under his supervision.

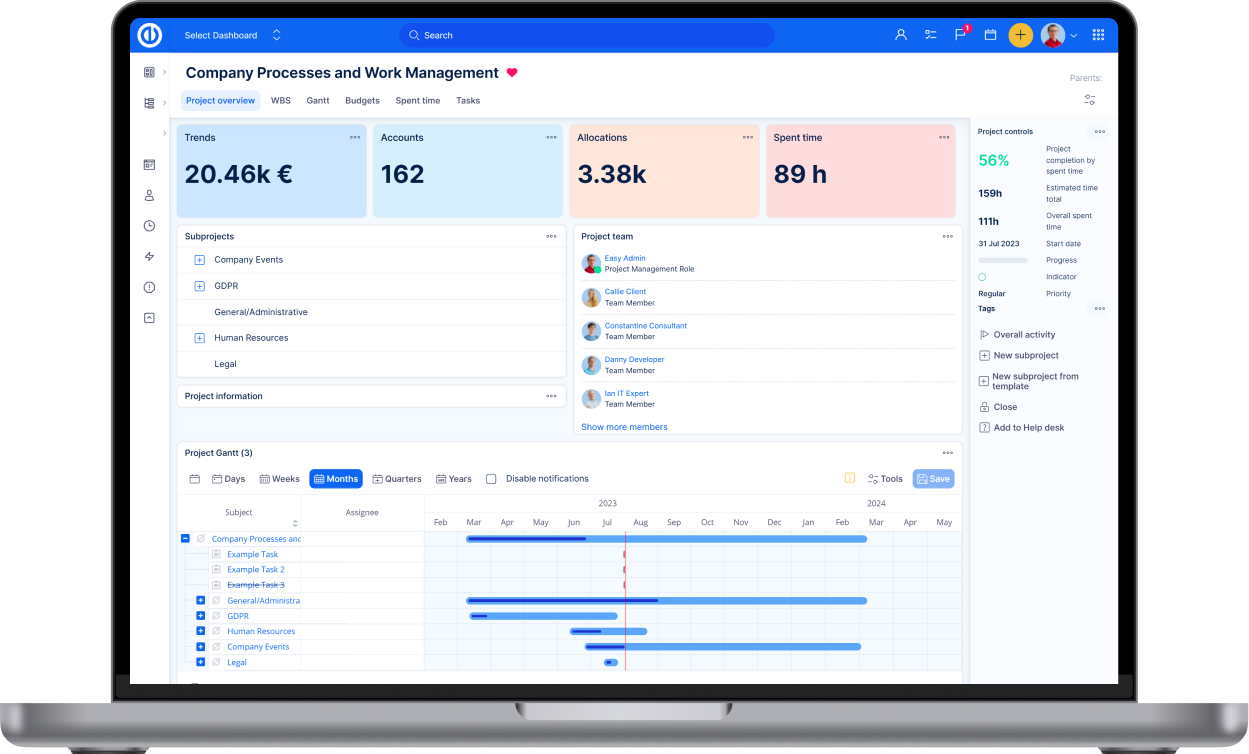
Creating a new project in Easy Redmine is really easy. You can use a template of another project for that purpose which saves time. But first, let's take a look on how to create a project without a template.

Business dashboards consist of three main features – global filters above dashboards, graphs and charts with click-through functionality, and trends. With global filters, a user can apply a filter to all or just selected modules on a personalized page together in just two clicks. Graphs and charts can be configured to show a specific page (dimension) upon a click on the chart values. Moreover, trends give you real-time values and trends overview just after one glance on a dashboard.

Any list of entries (projects, tasks, time entries, etc.) can be visualized in a graph or a chart, which are completely customizable. In just a couple of clicks using pie, bar or line chart, you can prepare a report on the performance of your project and demonstrate what needs to be improved.


Project finances can be visual. To have CBS – Cost Breakdown Structure, you need to have installed both WBS and Budgets plugins. All WBS finances are based on project budgets data where you have incomes/costs and personnel costs in plan and reality. This plugin is most useful during project planning, in budgets setting phase and ongoing project finance monitoring.

Resource dashboard (extension for Resource management plugin) provides you with a visual overview of all your resources on one dashboard. Take just one look at this dashboard and get instant insight into your KPI's and resource utilization levels.

This is one of the most important initial configurations in Easy Redmine. Once you get this done, you will have a perfect control over task tracking in the whole organization – from project owners to part-timers, and even to external parties, such as customers or external collaborators.

Try Global Gantt for an overview across all projects. Easily manage your project portfolio and adjust project timing and duration using drag & drop. Learn more in this short video tutorial.

Easy Redmine allows you to track time spent on tasks and projects in several ways, including stopwatches and manual input of time on tasks.

This short video tutorial shows the basic features of Easy Redmine, which comes with key features, such as Gantt Chart and Time Tracking. Easy Redmine has a responsive mobile design and is easily extensible with plugins for Resources, Finances, Agile management, and others.

Easily access updates, submit tickets and purchase new plugin through your Customer Portal

In this tutorial you will learn how to quickly create a bulk of tasts using Quick Planner.