The power of dashboards: How to utilize them, why they ease your work, and how they challenge your business

The business landscape is rapidly changing, and so are our data and information management requirements. One of the most crucial tools that can help us navigate this data universe is a dashboard. But how should we use it? Why does it ease our work? And how does it pose a challenge to our business?

Why use dashboards?
Dashboards offer a visual, interactive interface that allows us to navigate vast amounts of information easily.
Whether it's financial indicators, team reports, process tracking, or just a task overview for the day, dashboards offer a unique opportunity to gather and present this information effectively.
Dashboards provide contextual relevance, allowing customization to suit specific team or process needs. This ensures that everyone has their "own space" with the tools and data they need, enhancing efficiency and creativity.
It's also vital to share these individual spaces across the company. Dashboards enable this sharing, fostering collaboration and a united approach to goals. This balance between individualization and connection is key to success.
This visual tool offers a wealth of benefits for any business or organization, regardless of size or industry. Let's take a deeper look:
1. Increased visibility
Dashboards are designed to aggregate and display data from various sources into a single, easy-to-understand view.
They can provide real-time updates and insights into critical business metrics and key performance indicators (KPIs), giving you an accurate, up-to-the-minute picture of your operations.
This increased visibility can enable faster, data-driven decision-making and can be instrumental in identifying potential issues before they become problems.
2. Enhanced productivity
By centralizing information, dashboards eliminate the need to manually gather data from multiple sources.
This can significantly reduce the time your team spends on administrative tasks, freeing them to focus on more strategic, value-added activities.
Dashboards can also enhance collaboration, as team members can easily access, share and discuss data. Leading to improved collaboration not just between the team members but across organizational departments.
3. Simplified reporting
Dashboards can automate the reporting process, producing professional, insightful reports at the touch of a button.
This can save considerable time and resources, particularly in larger organizations where reporting can be a complex and time-consuming task.
Customizable dashboard views also mean that reports can be tailored to suit different audiences, ensuring that everyone gets the information they need in a format they can understand.
4. Improved decision making
Dashboards present information visually, often using graphs, charts, and maps.
This visual representation of data makes it easier to spot trends, patterns, and outliers, enabling you to make informed decisions quickly.
By providing a clear, concise view of your data, dashboards can support better, faster decision-making and can help ensure your decisions are backed by accurate, up-to-date information.
5. Increased accountability
By clearly displaying performance metrics and KPIs, dashboards can promote a culture of accountability within your organization.
Team members can easily see how their performance aligns with organizational objectives, and managers can quickly identify underperformance and take corrective action.
6. Scalability
As your business grows, so too does the amount of data you need to monitor and analyze.
Dashboards are inherently scalable and able to incorporate increasing volumes of data without losing functionality.
This makes them a future-proof solution that can evolve with your business, providing valuable insights regardless of how complex your operations become.
How to utilize dashboards in Easy Redmine
In Easy Redmine, several types of dashboards are tailored to the various needs of users:
My Dashboard
This dashboard is visible to every user in the left-hand menu and is ready for use. Users with the appropriate permissions can modify it to suit their needs.
Use case:
The homepage dashboard is customized to display critical KPIs such as the number of open tickets, ongoing projects, employee availability, and login spent time or attendance.
This allows every team member, from developers to project managers, to have a clear view of the current situation and facilitate their planning and task management.
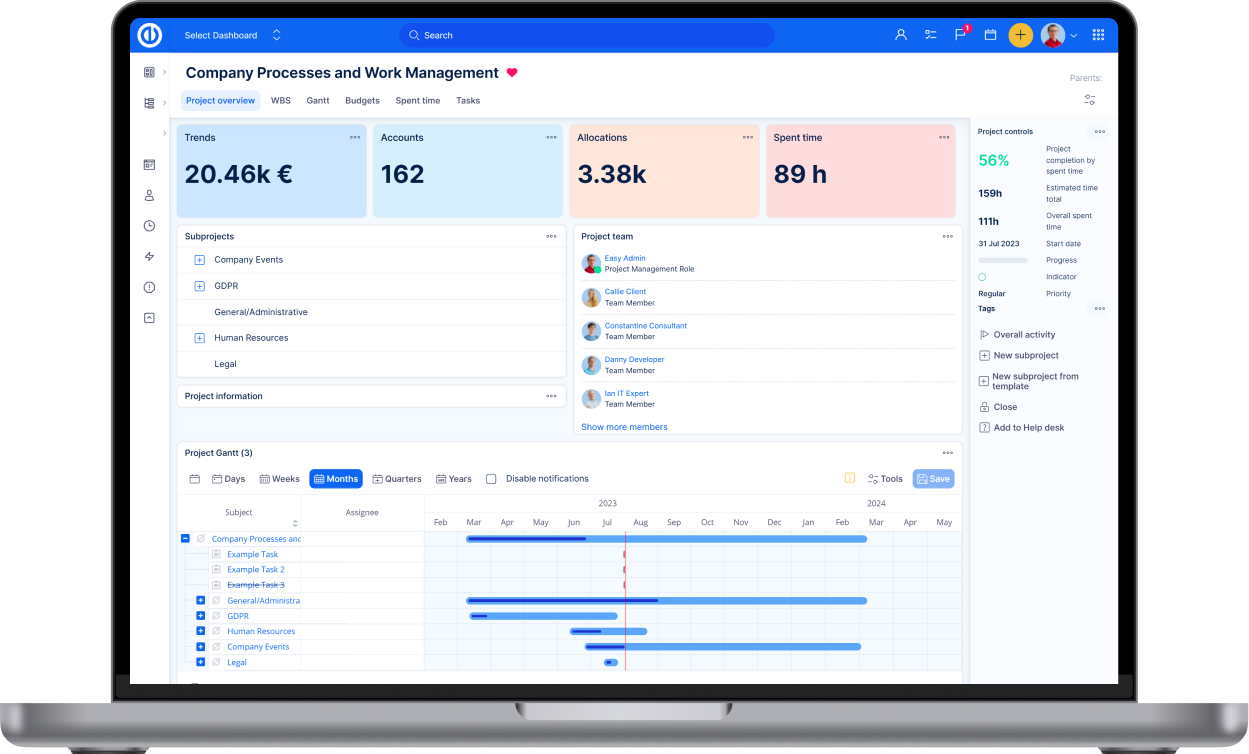
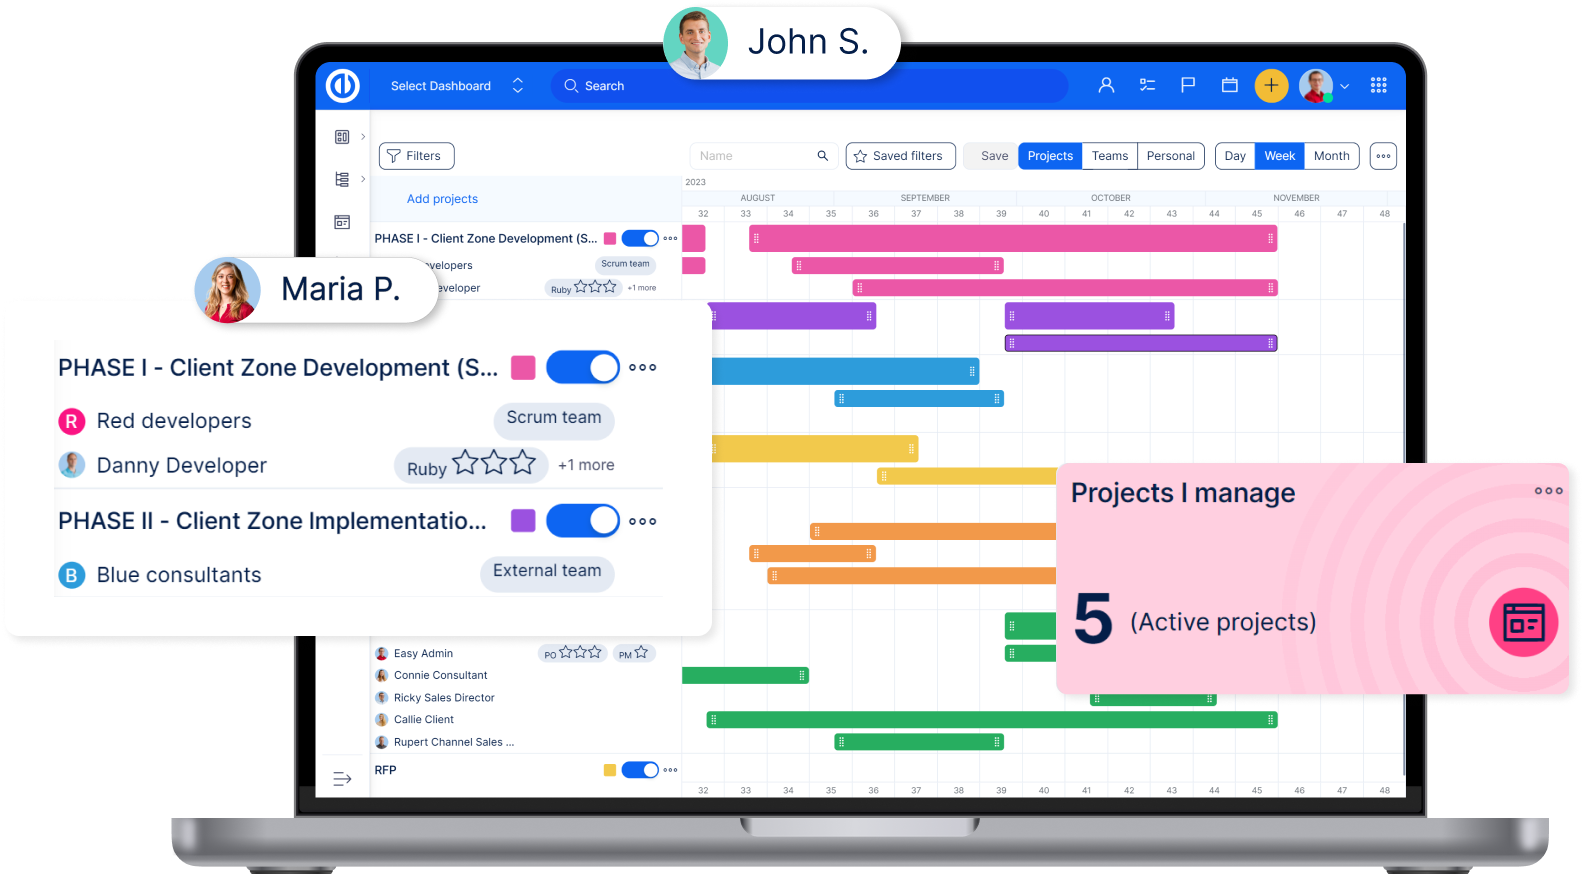
Project dashboard
This dashboard is accessible within each project, and again, users with the right permissions can adjust its content and structure.
Use case:
In an organization that runs multiple projects, each project dashboard can be customized to reflect the specific data and metrics relevant to that project. At the same time, with project dashboard templates, you can achieve the same look for all of your projects, giving you the ability to quickly sort and compare all projects and their chosen attributes.
This allows the project team to monitor progress effectively, instantly identify potential bottlenecks or challenges, and swiftly adjust their strategies as needed.
Feature Dashboard
These default features (like B2B CRM, Service Desk, Risk Management, etc.) are easily accessible in the right-hand menu (in the new design at the top) and are pre-set and ready for use.
Use case:
The built-in features may be used to streamline your customer relations management. The B2B CRM dashboard is used to track leads, customer interactions, and sales pipeline, while the Service Desk dashboard helps to monitor and manage customer service tickets, improving the efficiency of their customer service team and increasing customer satisfaction.
Custom Dashboards
This feature allows you to create your custom dashboards, which can be modified or deleted as needed.
Use case:
A company may create a custom dashboard to monitor real-time operational data, product performance, or even employee productivity. This provides the company with insights that are tailored to their specific needs, leading to more effective decision-making.
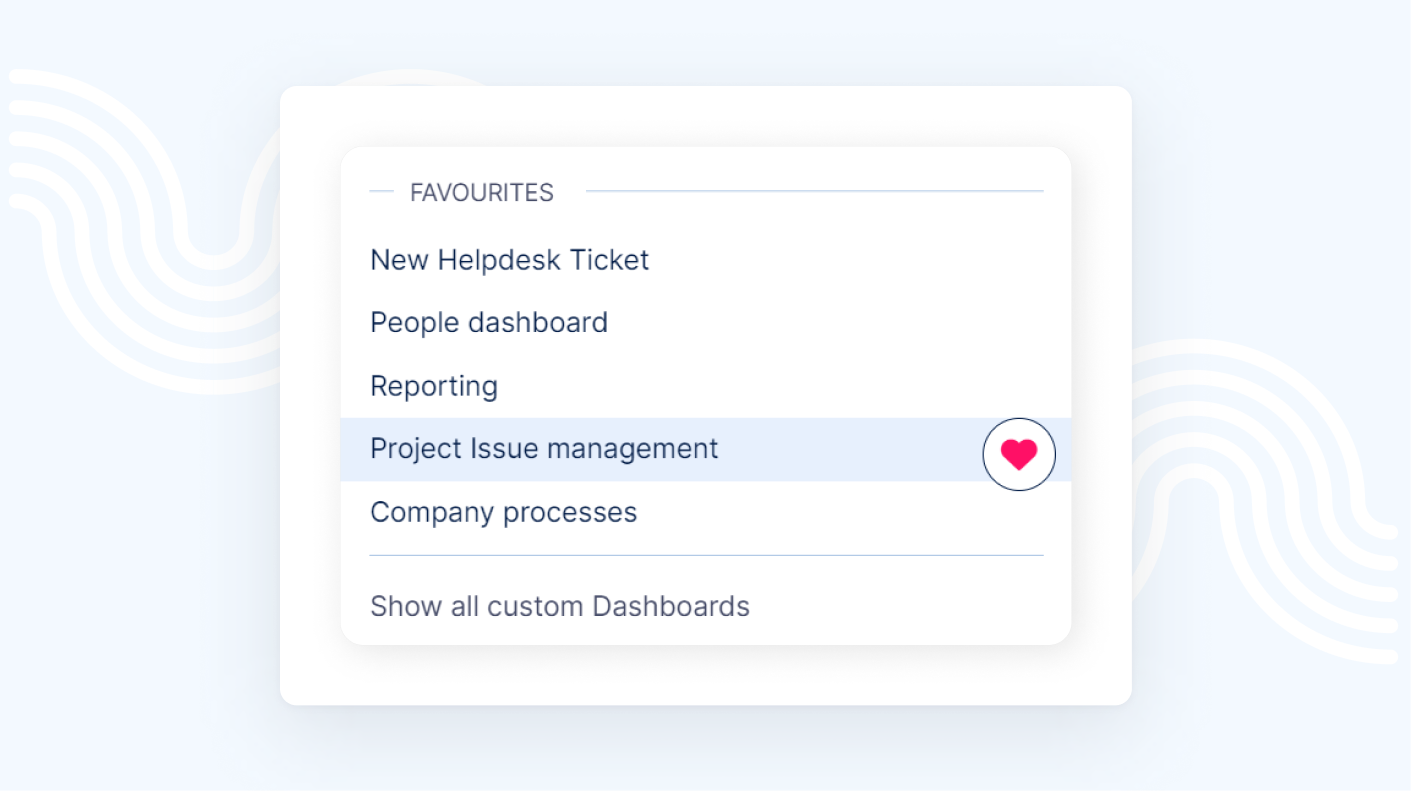
Jump to Dashboards
The ability to create and jump to your custom dashboard is useful in environments that manage a variety of operations.
Use case:
Great for every busy professional who needs to keep track of several different aspects of their work. You may need to monitor project timelines, team performance, financial metrics, and so much more. Without a consolidated and quick navigation tool, you might have to sift through numerous different pages or software to get the information you need, wasting your valuable time.
Try Easy Redmine and discover the power of dashboards
Manage projects efficiently with Easy Redmine dashboards. These customizable and intuitive dashboards efficiently visualize data, empowering you to make informed decisions swiftly. Whether tracking project progress or managing financial data, access vital information at a glance for better insights and increased efficiency.
With the Jump to Dashboards feature, switch effortlessly between different views, and keep your workflow smooth and uninterrupted.

All-in-one software for a modern project manager? Easy.
Get all powerful tools for perfect project planning, management, and control in one software.