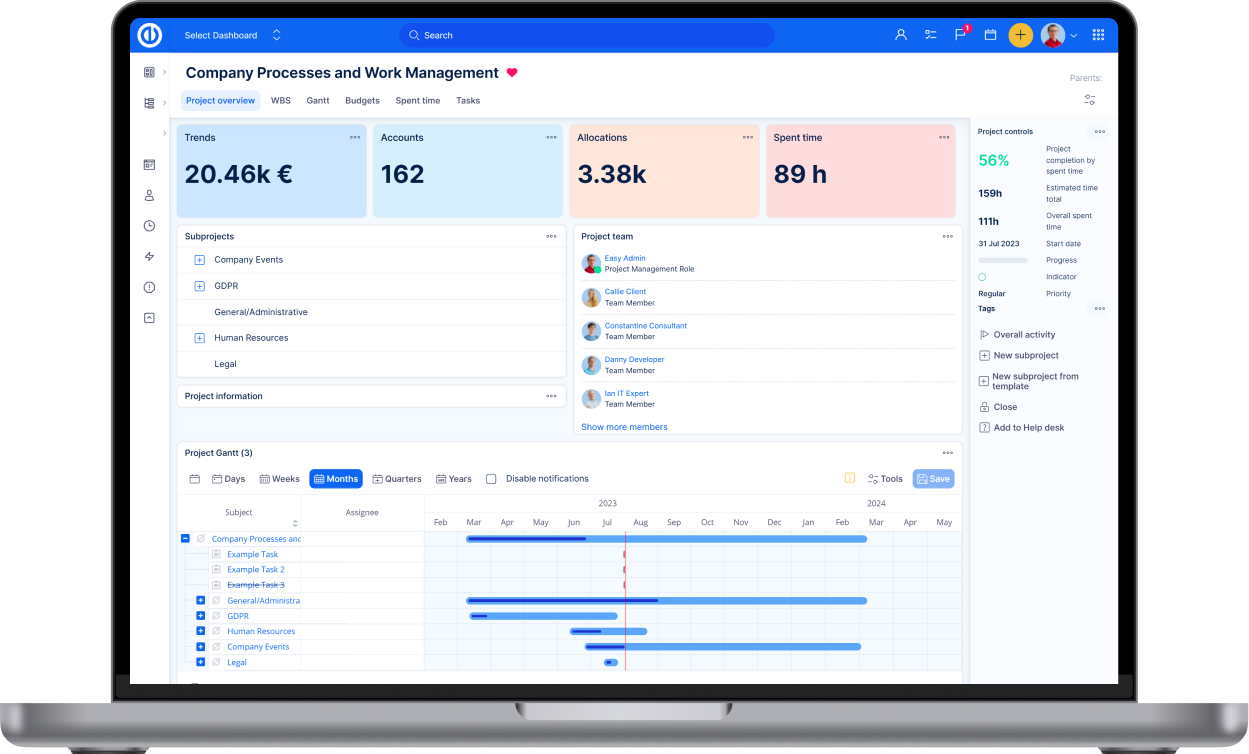
What is a dashboard visualization?
A dashboard visualization is an interactive tool that presents complex data in a visually appealing and easy-to-understand format. It combines multiple data sources and displays key metrics, trends, and insights using various charts, graphs, and other visual elements.
By leveraging dashboard visualizations, businesses can transform raw data into actionable insights, enabling better decision-making and improved performance across various departments and processes.