Key features:
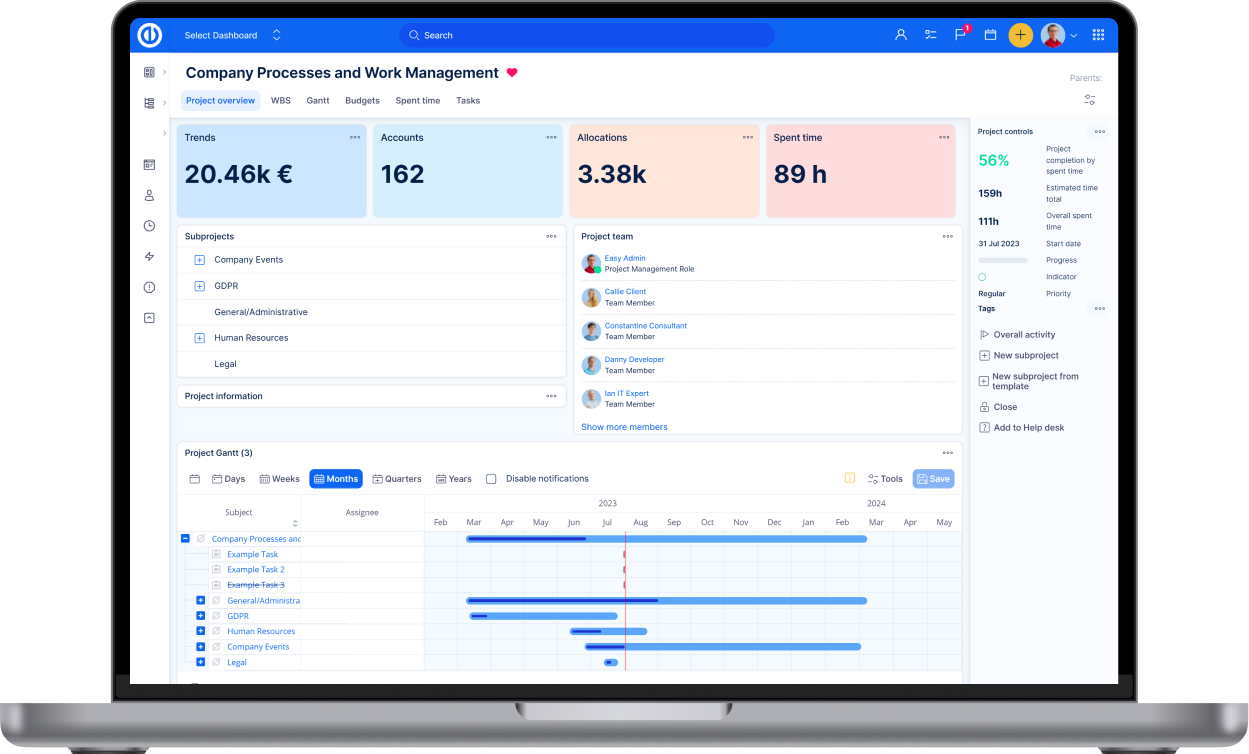
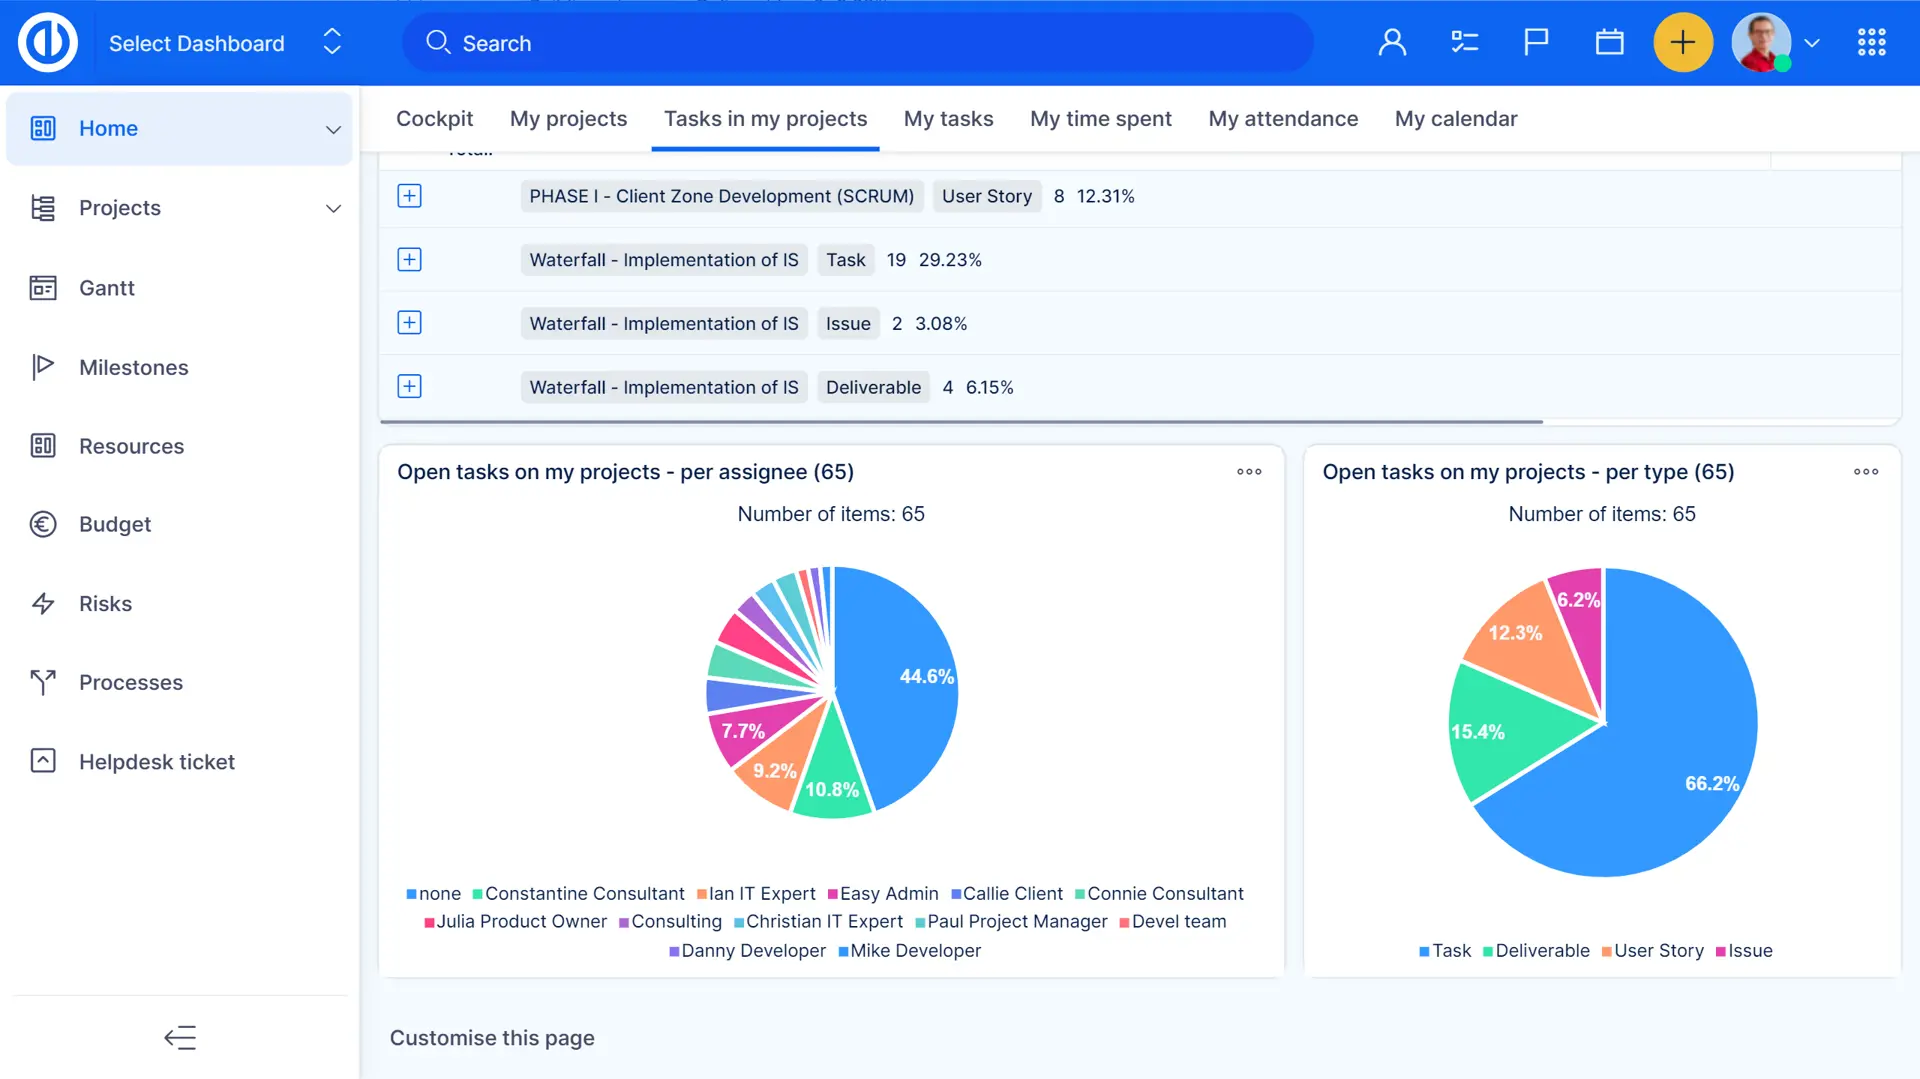
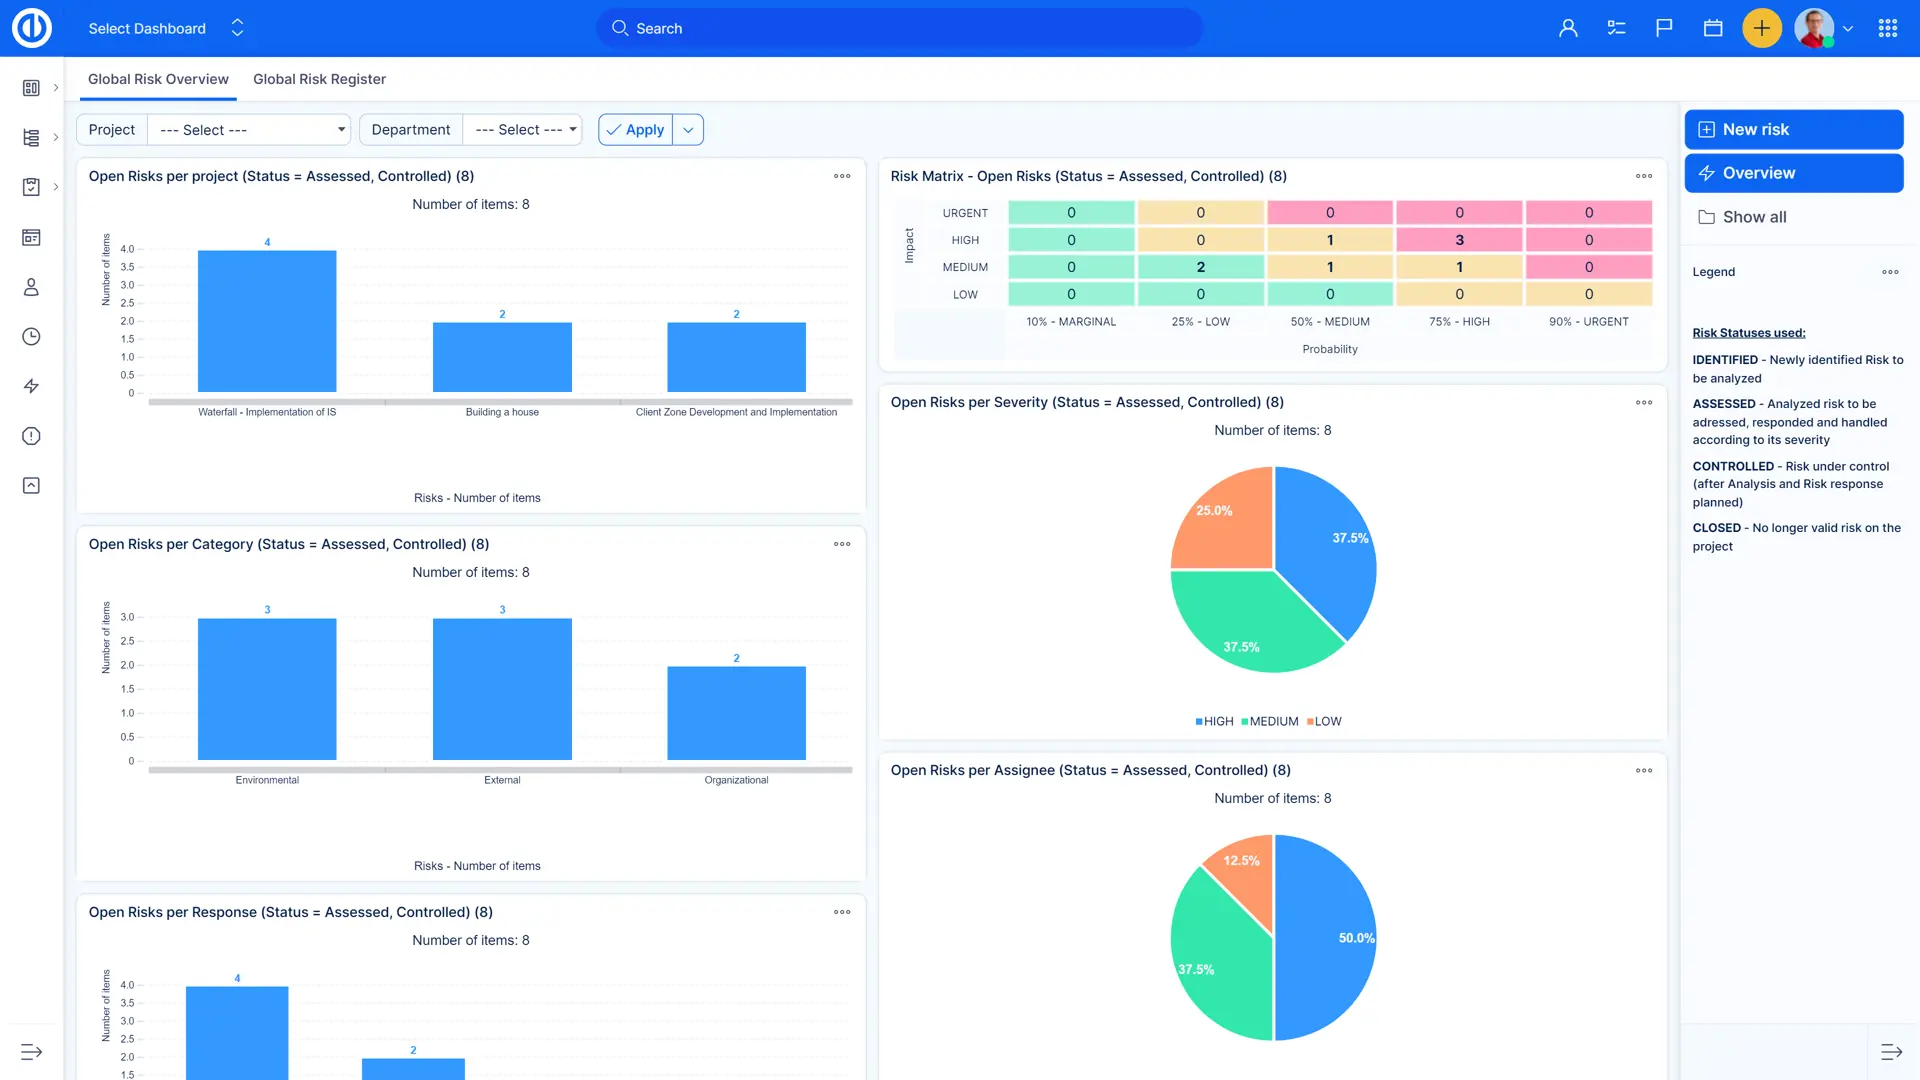
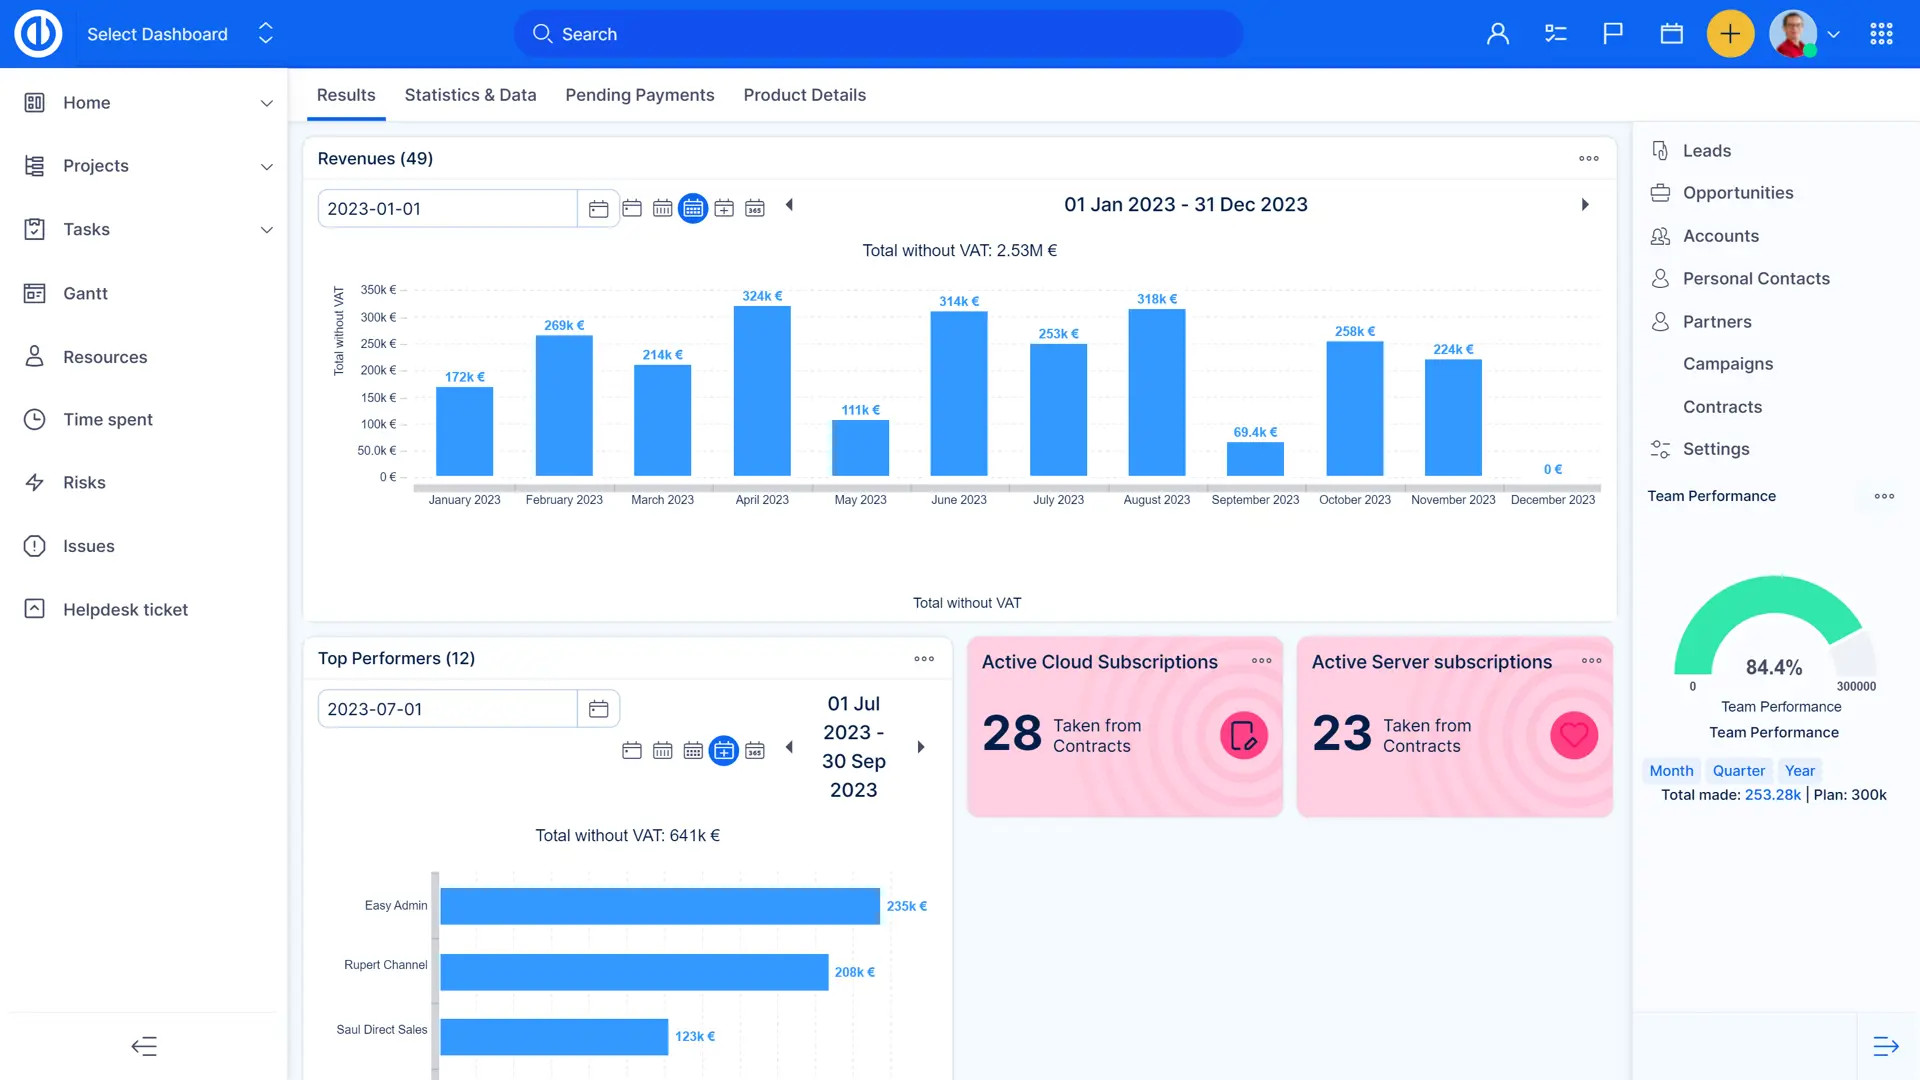
- Customizable graphs and charts of all listings
- Pie, bar and line charts
- With legend
- Available on all personalizable pages
- Suitable for reporting on project’s performance
Any list of entries (projects, tasks, time entries, etc.) can be visualized in a graph or a chart, which are completely customizable. In just a couple of clicks using pie, bar or line chart you can prepare a report on the performance of your project and demonstrate what needs to be improved.

Key features:
Integrate project, work, IT service, and source code management in one platform for technology projects.
Work smarter with secure, on-site AI that summarises, reads, and converts notes into actionable tasks.
Deploy on-premises or use ISO certified cloud. Open-source code audits ensure top-tier security for your IP.
Make data-driven decisions with Easy Redmine's real-time, customisable reporting features.
Product

Key features


Access all features, SSL protected, no credit card required.