Key features:
- Customizable graphs and charts of all listings
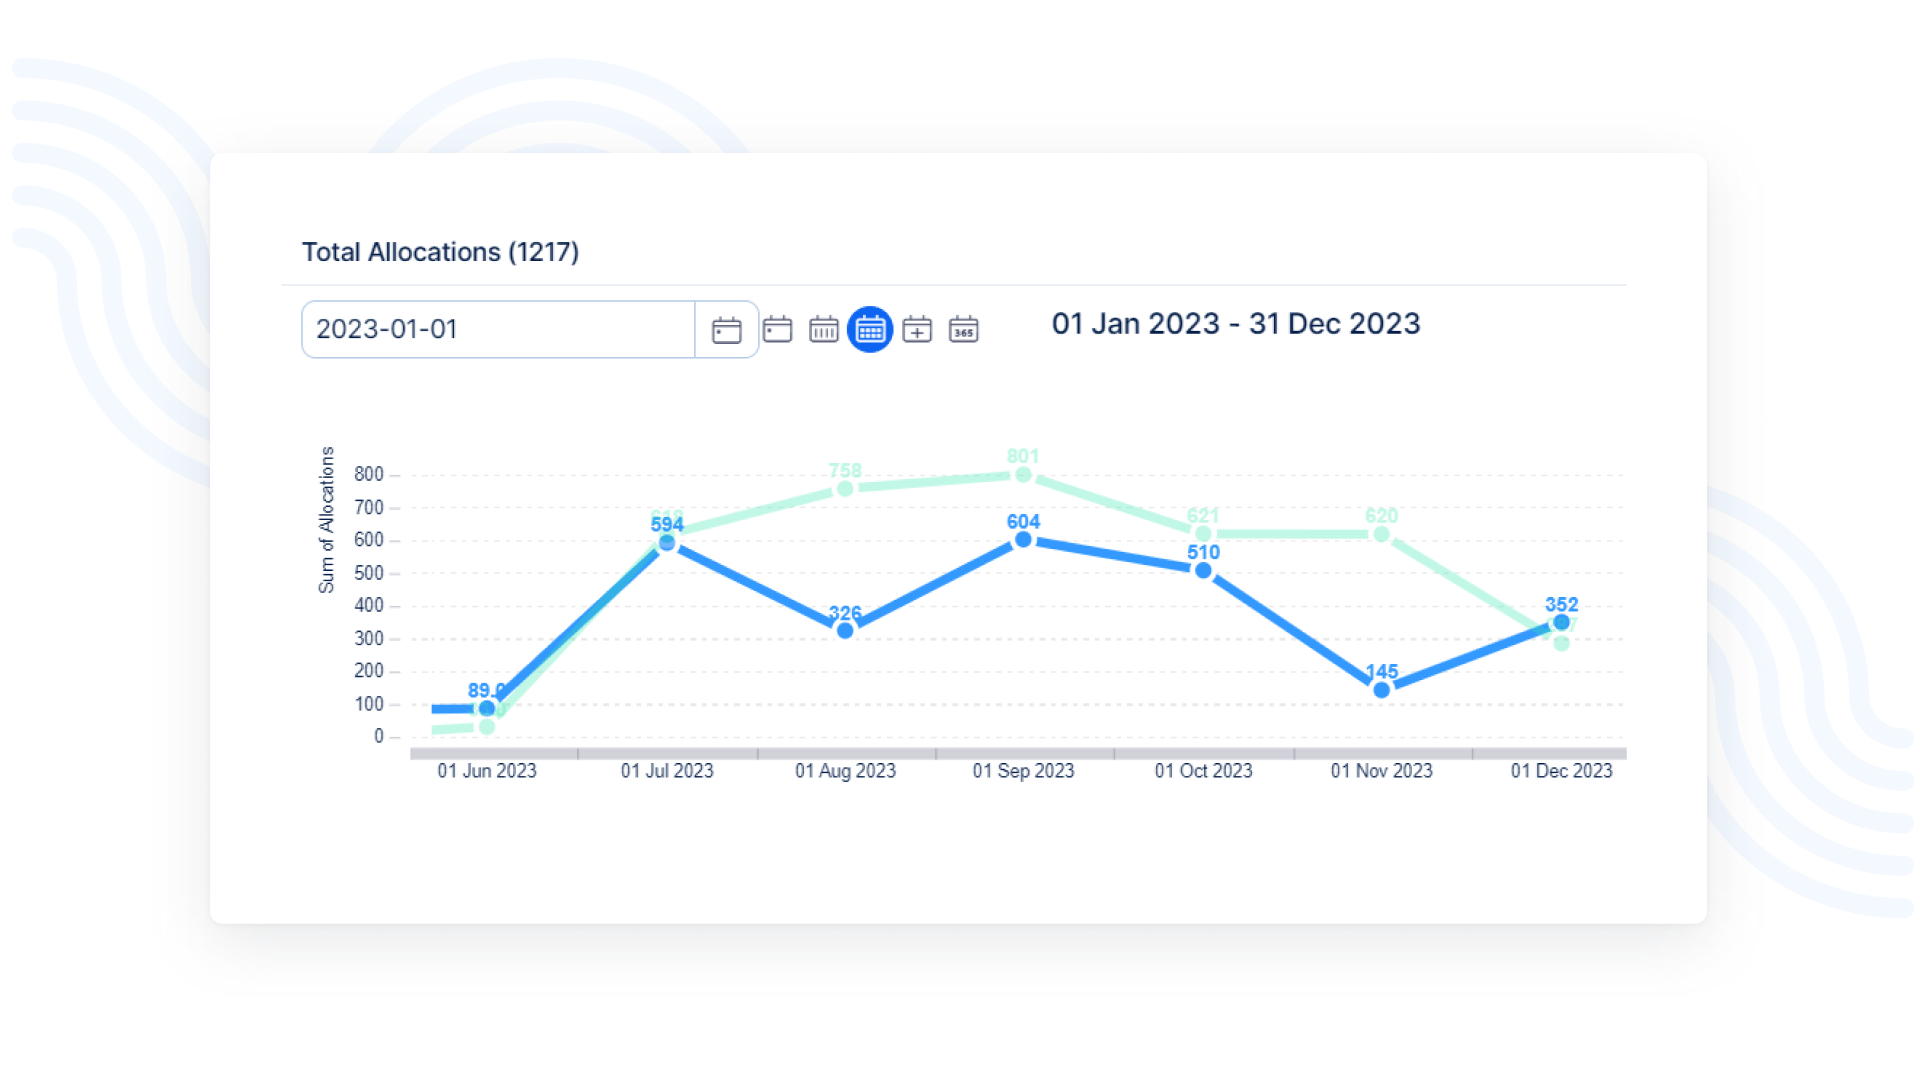
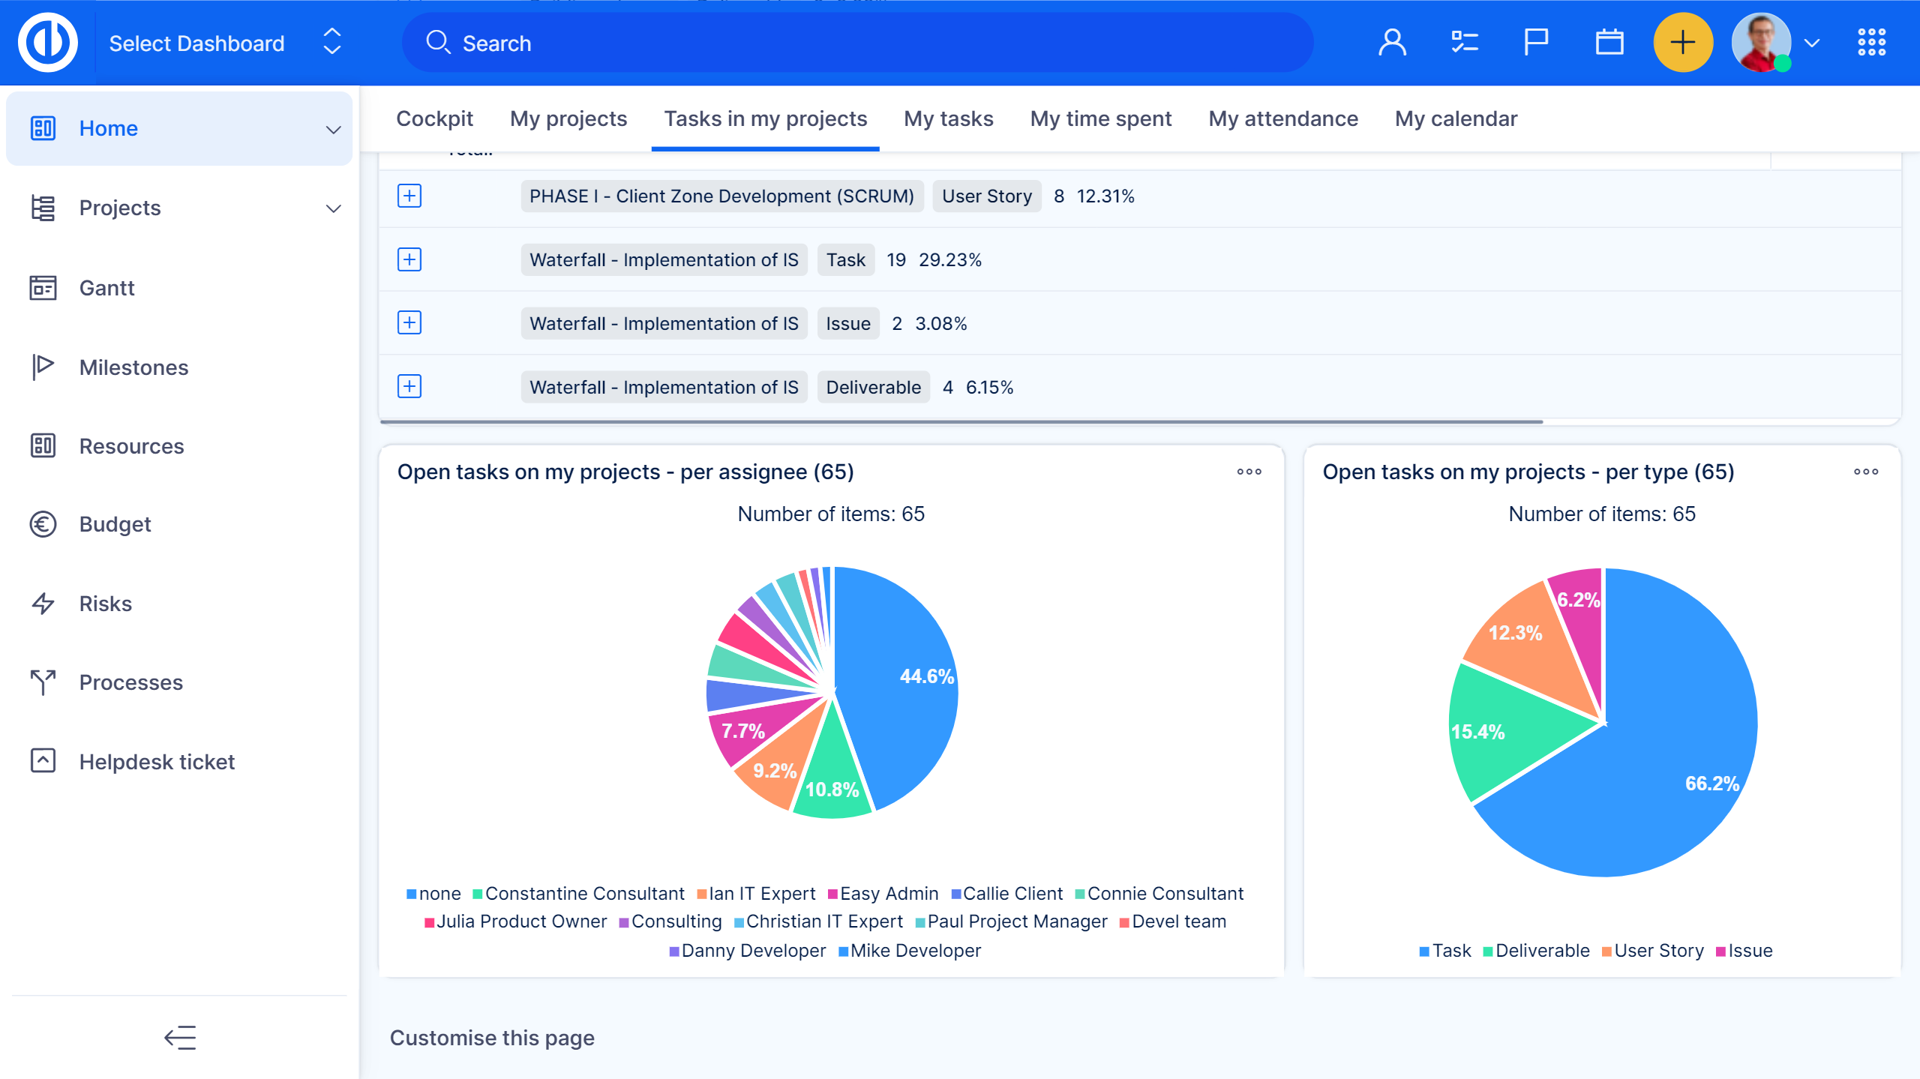
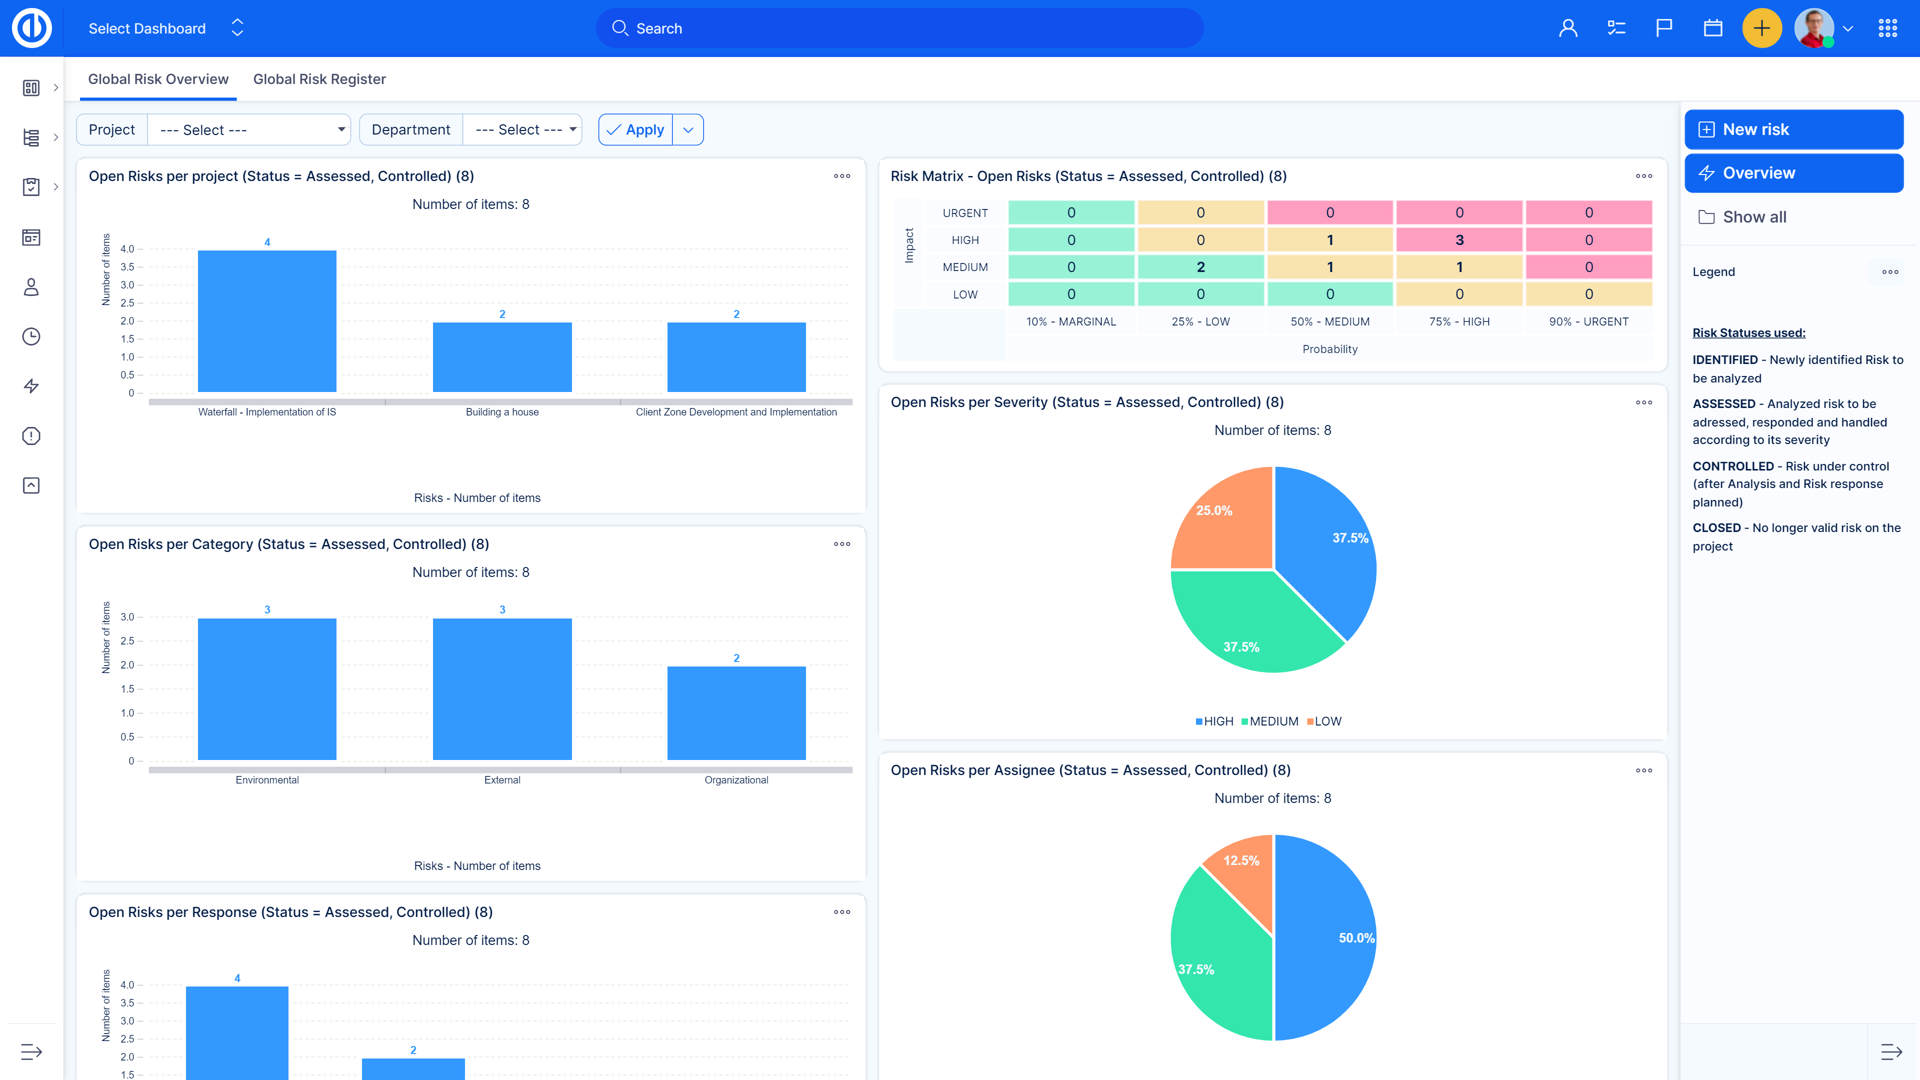
- Pie, bar and line charts
- With legend
- Available on all personalizable pages
- Suitable for reporting on project’s performance
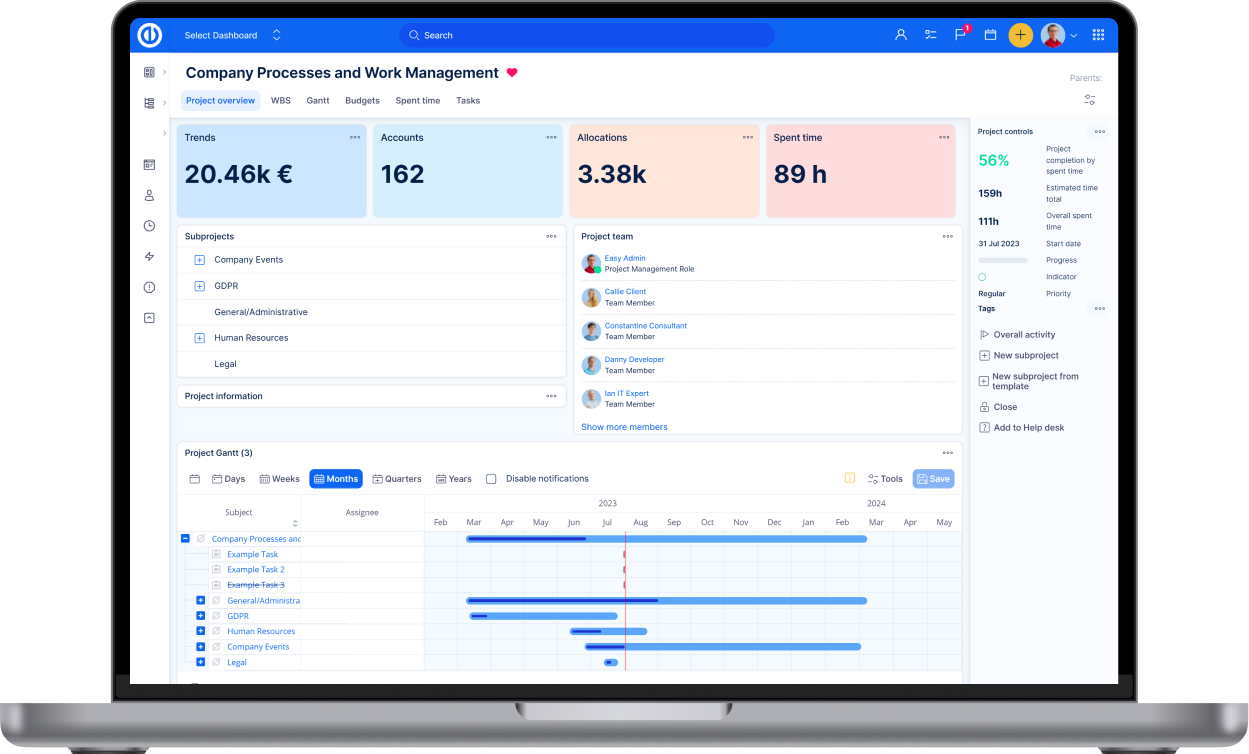
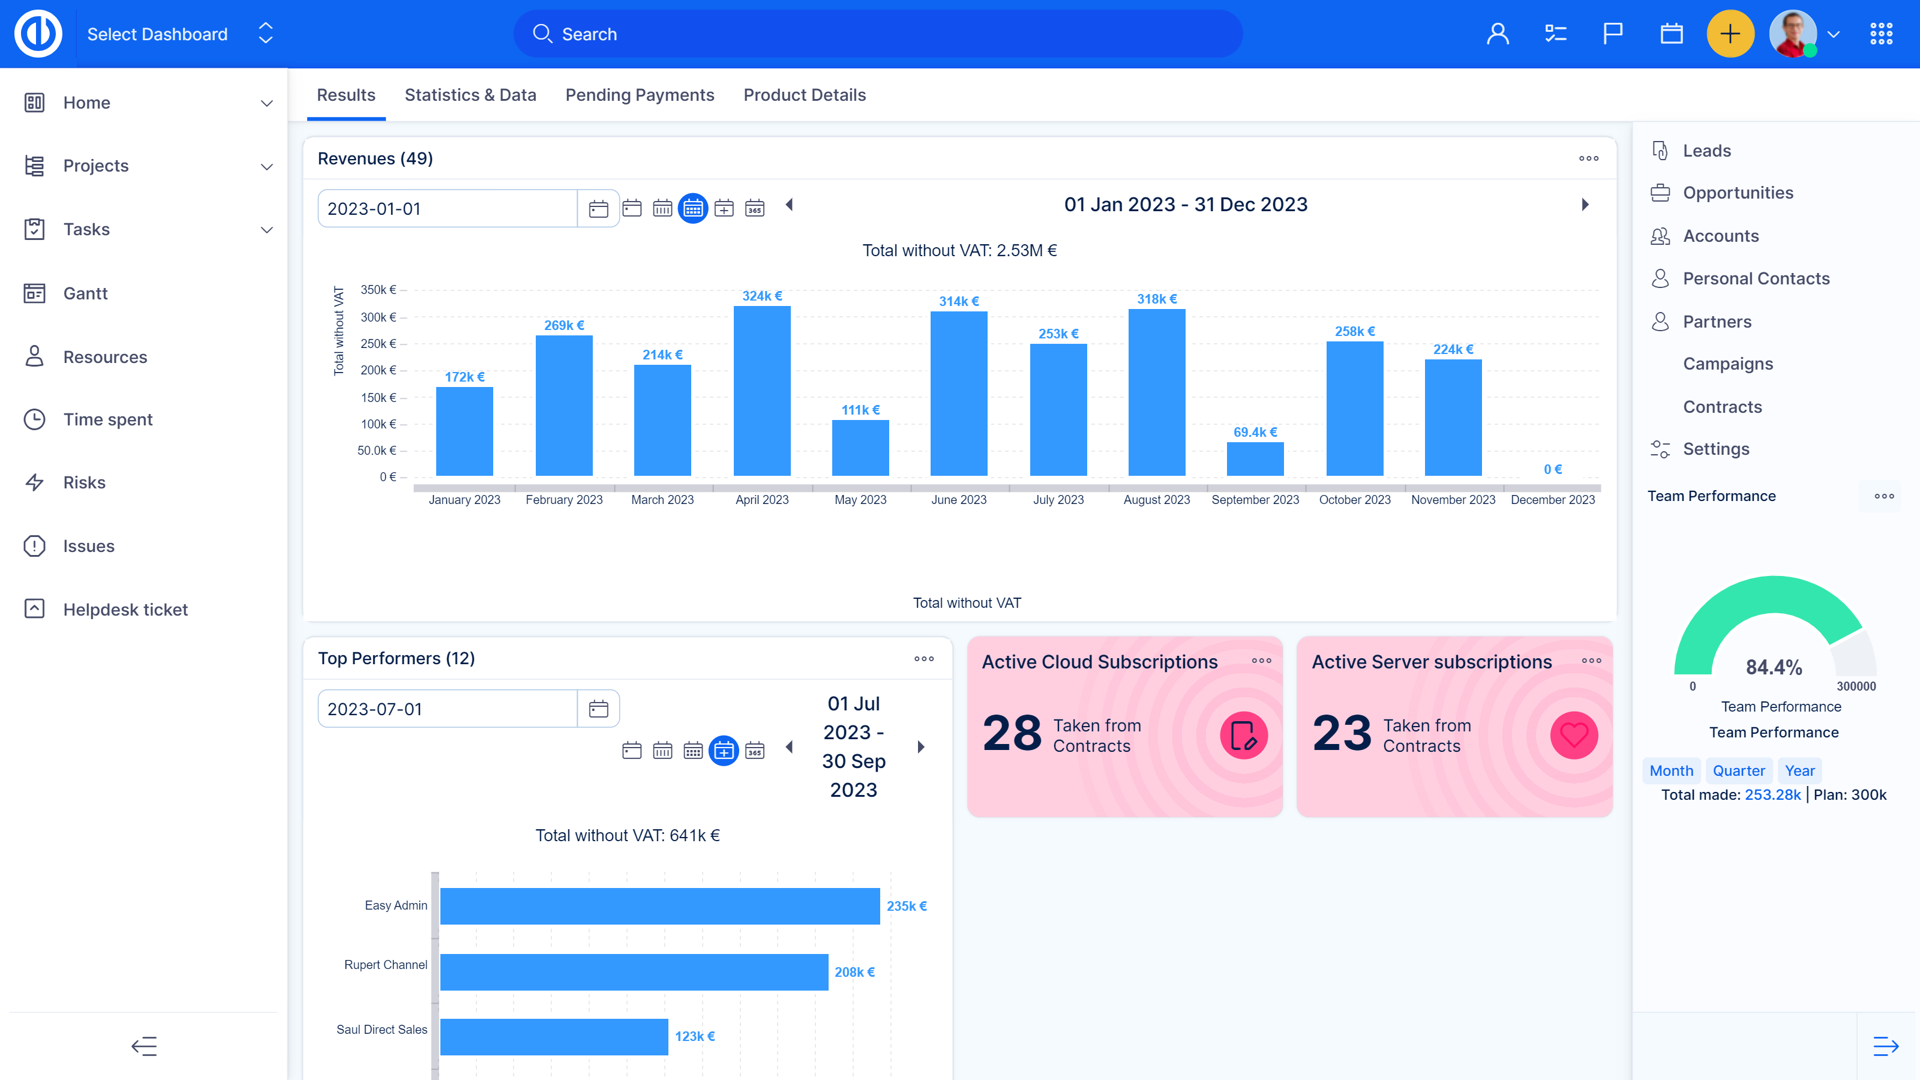
Any list of entries (projects, tasks, time entries, etc.) can be visualized in a graph or a chart, which are completely customizable. In just a couple of clicks using pie, bar or line chart you can prepare a report on the performance of your project and demonstrate what needs to be improved.
Key features:
Full features, SSL protected, daily backups, in your geolocation